Infographics are visual forms of content that take complicated subjects and turn them into easy to digest graphics. The reason infographic link building is so popular is because it provides a lot of value and simplifies a complex topic.
As a result, infographics become highly shareable and it’s a reason why a lot of people use infographics for link building.
Learning how to create infographics isn’t so easy and it takes a lot of time and effort to determine which infographics will generate the results you want.
In this guide, my goal is to provide a simple infographic link building strategy that you can rinse and repeat to generate more links for your website.
Why Use Infographics for Link Building?
Data shows that infographics can increase site traffic by 12%. Infographics are also 30 times more likely to be read than a full blog article.
Why is that?
Infographics help create visualizations of complex topics and they provide it in an easy to absorb way.
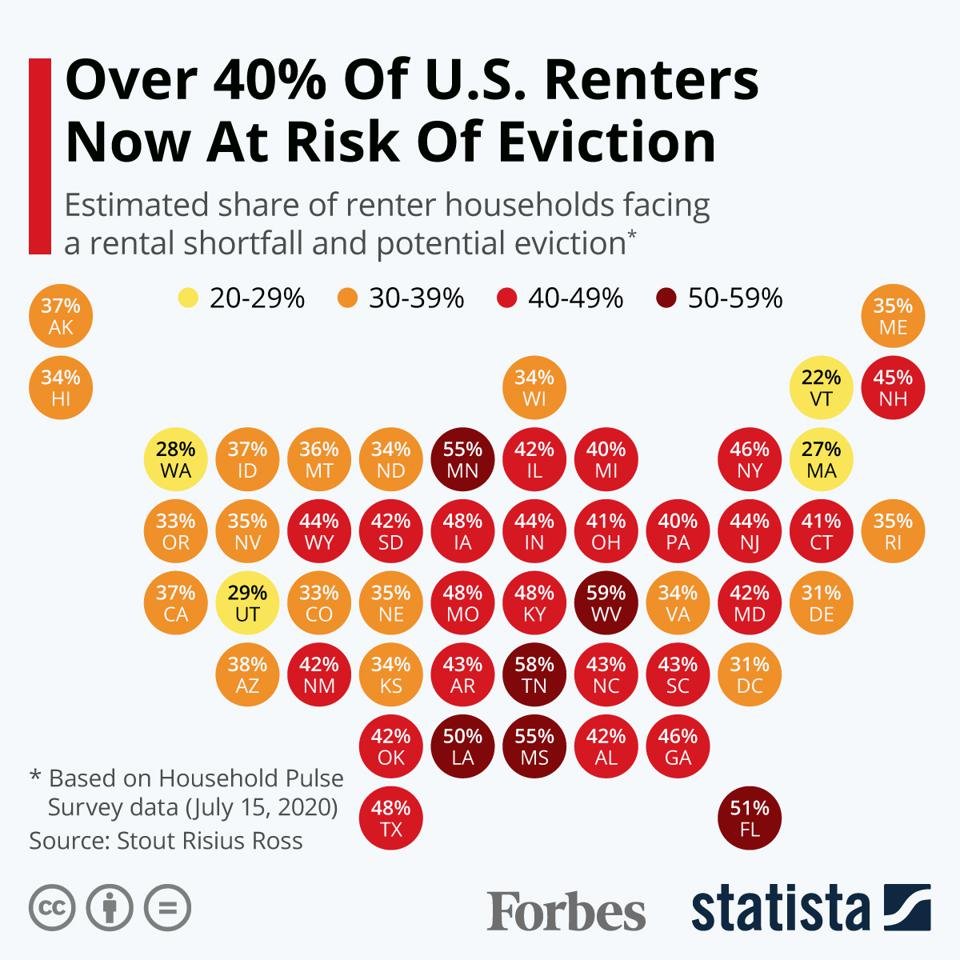
Here is an incredibly interesting infographic that breaks down the state of renting in the United States. It explains that more than 40% of renters are at risk for eviction and breaks it down to percentages by each state using a color coded map.
Certain states like West Virginia, Tennessee, and Minnesota have a higher percentage of renters facing eviction while states like Vermont and Massachusetts do not.
Now, if you had to read an entire blog article about this, it might be rather dry and boring but looking at it using an infographic actually makes it interesting.
This is another reason why link building infographics are so powerful because they can take dry topics and make them look more interesting and enticing. When I look at that map, it makes me want to stay a while, look for my state, look at states that have higher numbers, and think about why that is.
Types of Infographics
There are six primary types of infographics that you can create for your outreach campaign.
Informational Infographics – These provide a plethora of information broken down into an easy to absorb image.
Timeline Infographics – The timeline visualizes a set of circumstances or points in time and communicates how things have changed or developed during that time.
Statistical Infographics – A statistical infographic breaks down a large number of statistics to help readers visualize how the statistics impact us.
Process Infographics – These provide a chronological highlight of events broken down into stages.
Comparison Infographics – Comparison infographics compare two similar subjects side-by-side to help the reader understand the difference between the two.
How to Create a Great Infographic
As you can imagine, creating infographics takes a little bit of design skill and strategy. You need to know what to create the infographic about, how to determine your ideal target audience, and then how to do your link building outreach to actually get people to see the infographic.
Let’s take a look at some of the main steps involved in creating an awesome infographic.
Research and Strategize
An infographic is content right? It’s just a different form of content.
No matter how great you are at designing things and making illustrations look beautiful, if the information in the infographic isn’t useful and enticing, it doesn’t matter because your design will flop.
You need new and relevant data to convert into a design that keeps people interested and makes them want to share your infographic.
Most importantly, your data needs to be original. It needs to be something that people can’t just get anywhere or in other infographics. If you can do this, you dramatically increase the chances of other bloggers and website owners sharing your content.
But how do you find exclusive content that people would want to share?
Start with your niche and use visual.ly to research popular infographics in that niche.
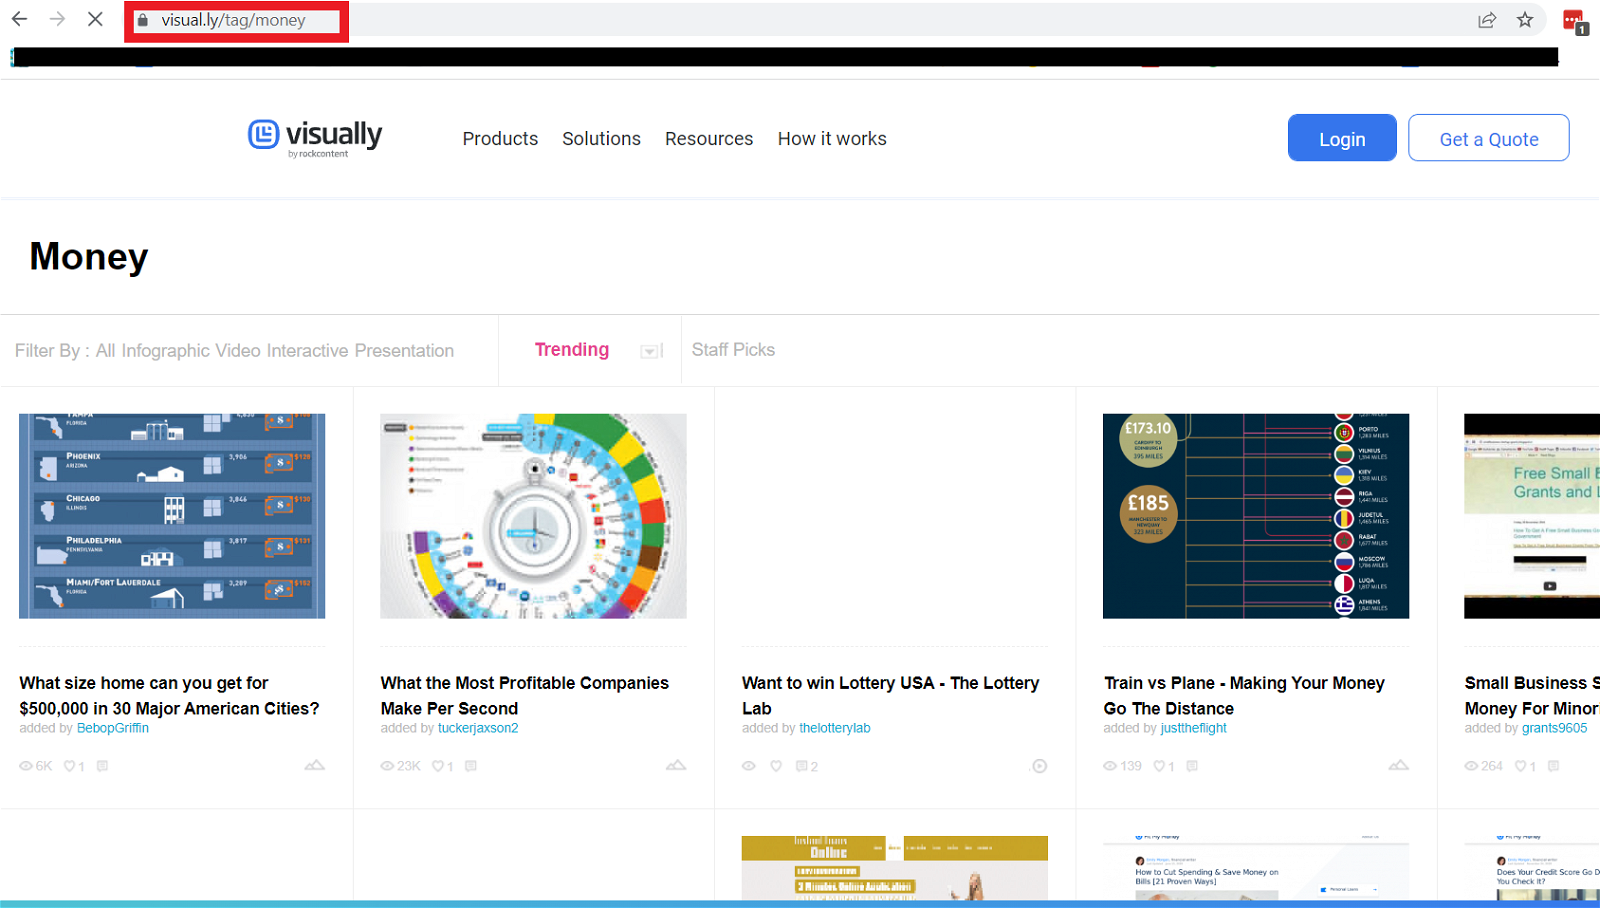
In this example, I used the tag “money.” Visual.ly/tag/money is the URL and you can change it based on your niche.
Once you find a concept that you like, you need to figure out if it’s getting links or not. If the infographic does not generate a lot of links, you won’t want to create one around that subject.
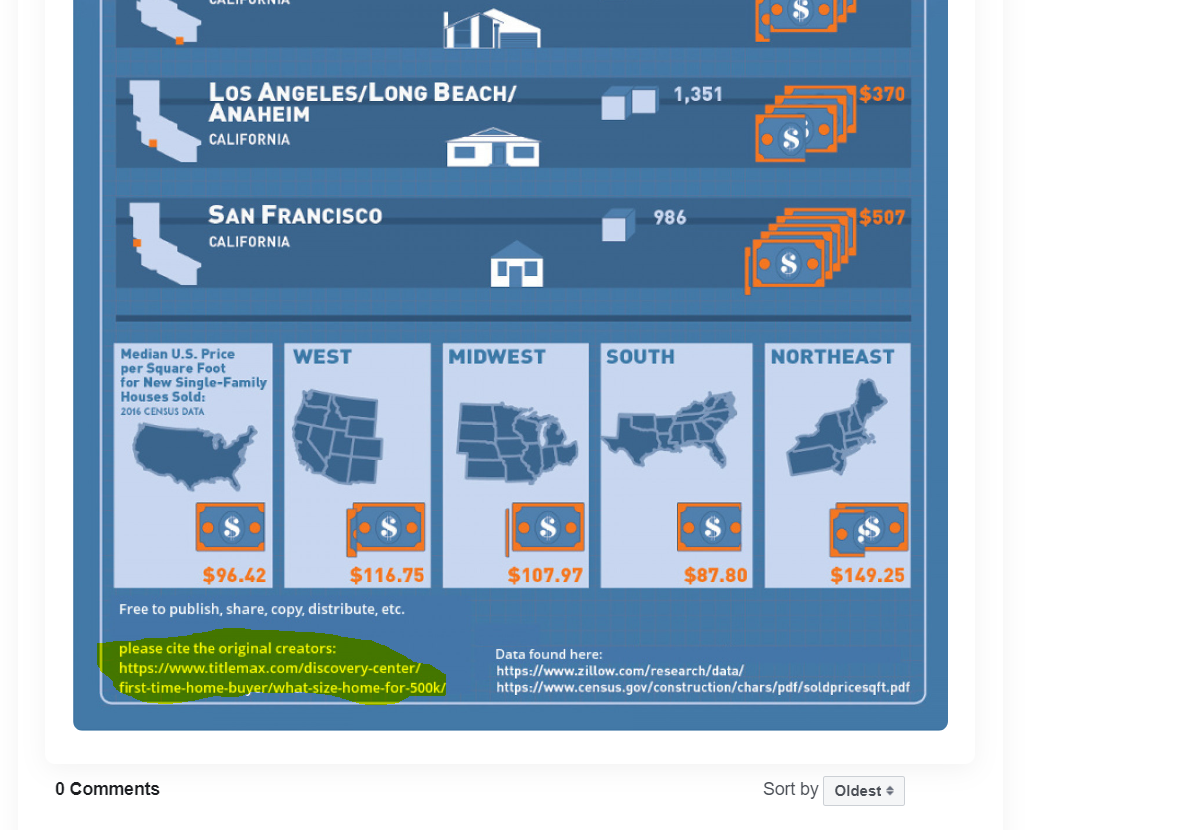
If you scroll down to the bottom of the page on one of the infographics, you’ll find the original link of where the infographic came from.
Head over to the Ahrefs Site Explorer and put that URL in the empty field. Doing this will show you how many referring domains link to the infographic. If there is a high number, chances are creating an infographic around this subject could be beneficial.
Have a Clear Audience
Once you have a concept for your link building campaign, you need to have a definitive audience. You need to understand the people that will be looking for the information you’re putting on a graphic.
If you’re focusing on a very niche subject, you’ll have a clear cut audience and while it might be a smaller audience, they’ll be more dedicated to the topic.
Take overfishing for example.
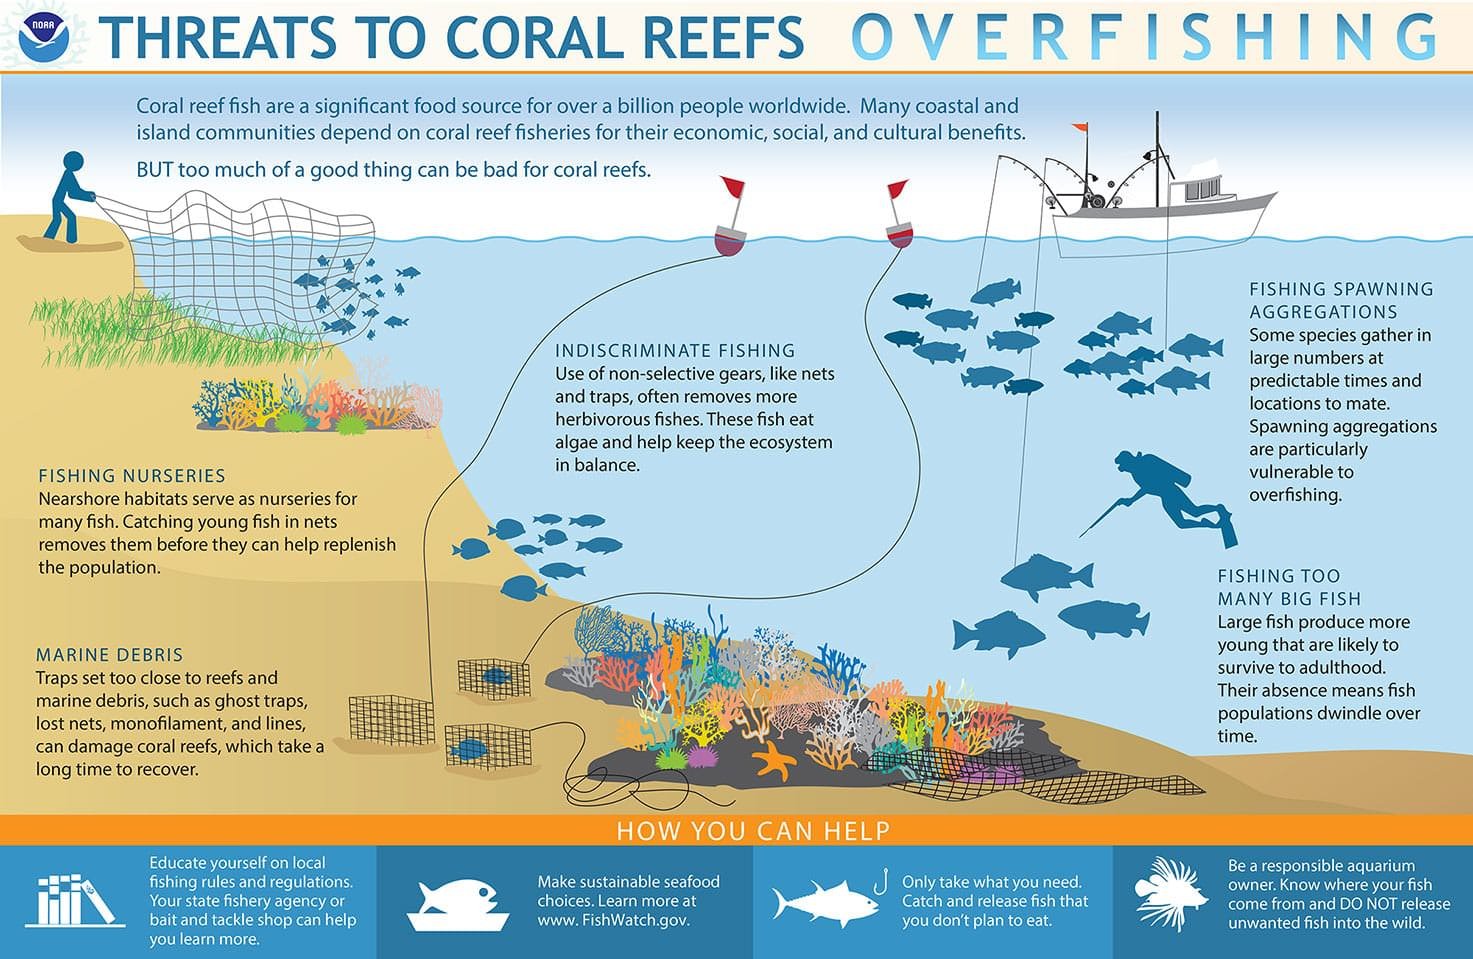
This is an incredibly niche subject that a lot of people would never think about or even be familiar with. But, to the right audience, this is powerful information and a visualization that could be useful for getting their point across.
As a result, this page has over 400 backlinks from 225 referring domains.
If we take real estate as an example, it would be a much broader topic with a less targeted audience because a lot of people are interested in real estate and it’s a trendy topic.
It’s crucial that you know who your audience is and where to find them because it will help you create a more compelling infographic that speaks to a specific group of people.
Use the Right Design Platform
Now that you have some topics in mind and you understand the audience you’re targeting with this information, where do you go to create infographics?
Truth be told, most of us SEOs and digital marketers aren’t exactly design experts with premium design tools and programs to create stunning graphics. If you plan to build links with your infographics, they need to look good.
Canva – This is a great free tool that comes with a number of free infographic templates that you can build on. There are also freemium options that you can use. Use Canva for basic informational infographics.
VistaCreate – This tool is primarily used for creating social media graphics but you can create amazing infographics here with the right methods. (used to be called Crello)
A quick Google search will likely bring a ton of different results for sites you can use to create infographics. It’s important that you take the time to build an infographic that looks good, has great information, and provides data in a way that is easy to absorb. This step will make or break the success of your infographic promotion.
How to Get Links With Infographics
You’re sitting there with your infographic complete and ready to wow the world with its greatness. Now what?
How do we turn that design into something that can build links and generate attention?
Publish Your Design
The first step is to actually publish your infographic in a blog post so it can build links.
Other content creators and website owners need somewhere to link to so be sure to create content around the infographic so it doesn’t look like you just copied and pasted an image on the page and expect people to link to it.
This infographic needs to serve as a comprehensive resource that provides extensive information about a subject that cannot be found anywhere else.
If you do keyword research and actually create quality content around the infographic you may even rank for keywords and start building links naturally without having to reach out.
One of the biggest benefits of link building is that there’s a compound effect. The more link building you do, the more links you can generate naturally.
Be sure to end the post with a call to action asking the readers to share the infographic on their website. Keep the embed code there and ask them to shout you out if they found it useful.
Outreach
One method is to reach out and see if people are interested in sharing your infographic.
Remember when we were trying to see how many referring domains the infographic had? This is where that comes into play.
Now you want to take those referring domains and compile them in a spreadsheet.
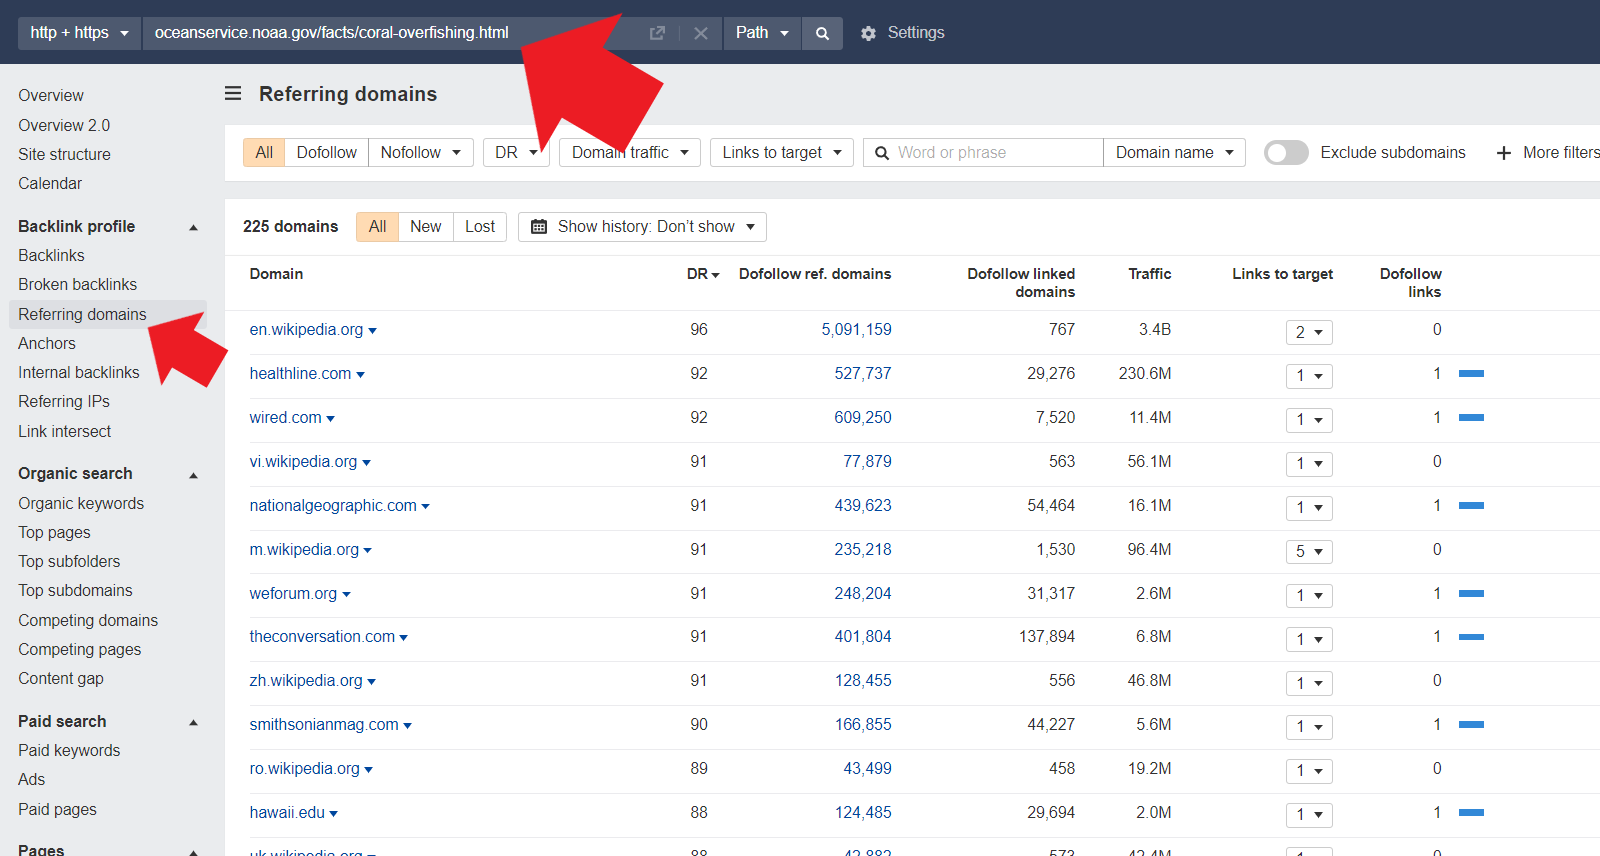
This provides you with a long list of domains that are already interested in the subject matter.
Take all the qualifying domains that you think you’d be able to get a link and export them into a spreadsheet. You can narrow down the search by domain authority to increase your chances of reaching out to websites that will actually respond.
For example, sending an email to wikipedia or wired.com isn’t likely to yield much in terms of results.
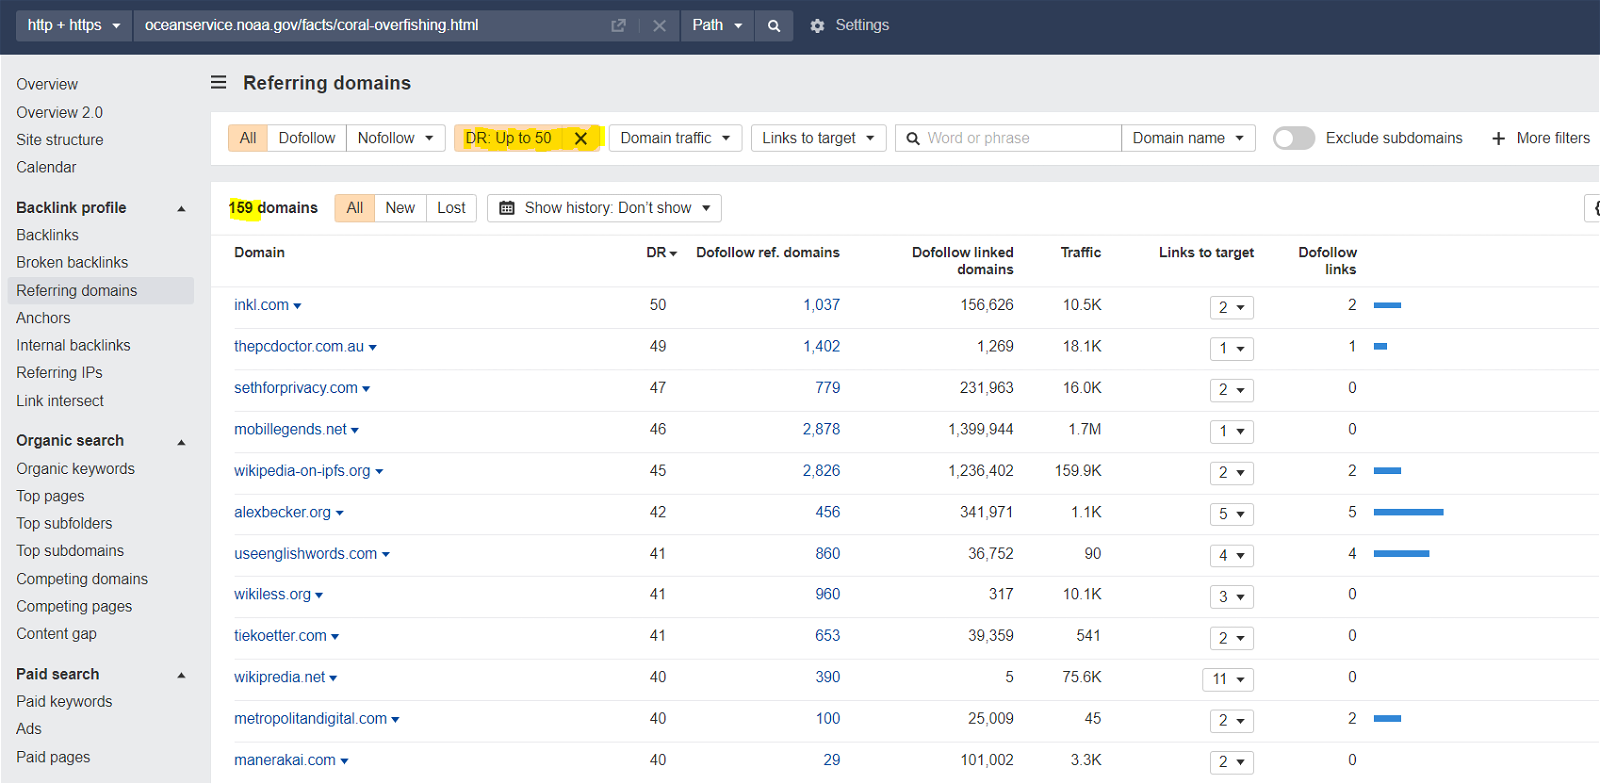
Filtering by domain ratings up to 50 could potentially bring better results that you’ll be more likely to get a response from if you reach out to them.
Once you have a list of qualified domains, you’ll want to import them into an outreach tool like Pitchbox or Mailshake.
You’ll need to have their email address, first name, and website so you can include all of this in the outreach email.
Hunter.io is a great tool to find email addresses and contact information from websites. It scrapes the website to find that information and gives you a rating on how accurate it will be to prevent bouncing.
Lastly, the success of your link building campaign is going to weigh heavily on the emails you send when you’re reaching out. There are a few things to keep in mind when you’re pitching your infographic:
1. Keep the email short and sweet, get right to the point
2. If possible, get them to use an embed code rather than copying and pasting the image
3. If they don’t use the embed code, send them a follow up asking them to link to you
4. Follow up at least two times, use the follow ups as a way to bump the email to the top
5. Offer to share their blog post on social media once they’ve uploaded the infographic
Remember that link building is a numbers game and no matter how create your emails and infographics are, many people will not respond to your emails. That’s perfectly normal so keep chugging along.
Share on Social
If you have a strong social media following, this could be a great way to get attention to your infographic. Determine which platforms have the best reach for the content you’ve created and share it there.
For example, business related content may perform better on LinkedIn than it would on Instagram. You could even share bits and pieces of the infographic over time leading up to its release if you think your audience would be interested in that.
Lastly, you could also reach out to relevant pages on social media to see if they’d be interested in sharing your infographic on their page.
Sending a quick voice or video message on social media is an awesome way to set yourself apart from the competition and show that you’re serious about your infographic content and you really want to spread the word on a particular subject.
Utilize Infographic Directories
Infographic directories are a great resource that you can use to submit your infographic and get it published on the site.
A lot of these directories have high domain ratings so they actually provide high authority backlinks to your website.
Not to mention all the additional publicity you’re going to get by being featured on the directory. You’ll get your infographic in front of a much wider audience that is actually interested in these designs which will increase your chances of getting more links.
Final Thoughts
Building links with infographics is simple once you understand that it’s just another form of content.
Don’t complicate the design elements but instead, focus on the data. Make sure that the information you’re putting into your infographic is interesting, enticing, and unique. Once you’ve done that, it all comes down to your outreach targets and your ability to use tools like Ahrefs to find referring domains.
Follow the steps outlined in this guide and you’ll have no problem. If you still find yourself struggling to build infographic links to your site, we’re here to help!

